
A Percentile calculation helps compute the statistical percentile of values in a view.
Using Tableau’s Global Superstore Orders table:
- Drag an Order Date field from the Data pane to the Columns shelf.
- Drag a Sales field to the Rows shelf.
- Drag another Sales field to the Rows shelf.
- Right-click on the second Sales field, select Quick Table Calculation and Rank
- Drag another Sales field to the Rows shelf.
- Right-click on the third Sales field, select Quick Table Calculation, and Percentile
- Drag an Order Date field from the Data pane to Color on the Marks card.
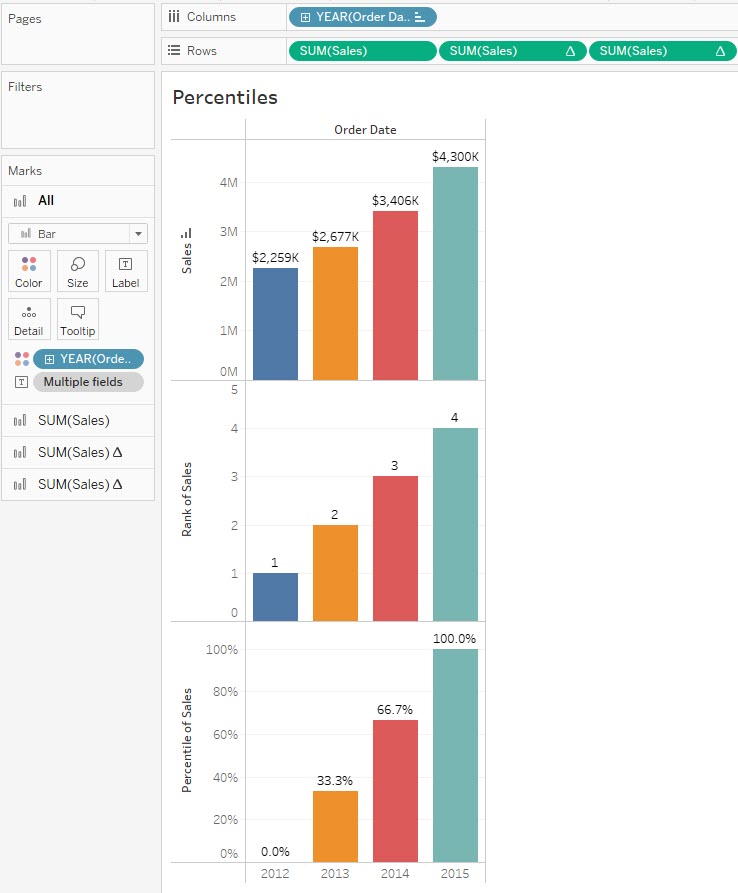
To illustrate, I have added three measures on the Rows shelf. The first measure is an aggregated Sales field. The second measure is an aggregated Sales field with a rank computation. The third measure is an aggregated Sales field with a percentile computation. If you divide 100% by 3 positions to the left (see Rank chart), you will obtain 33.33 – the value to be incremented on the Percentile chart; that is 33.33 + 33.33 = 66.66; then 66.66 + 33.33 = 99.99 or 100%
Format: You could format the fields with corresponding currencies.